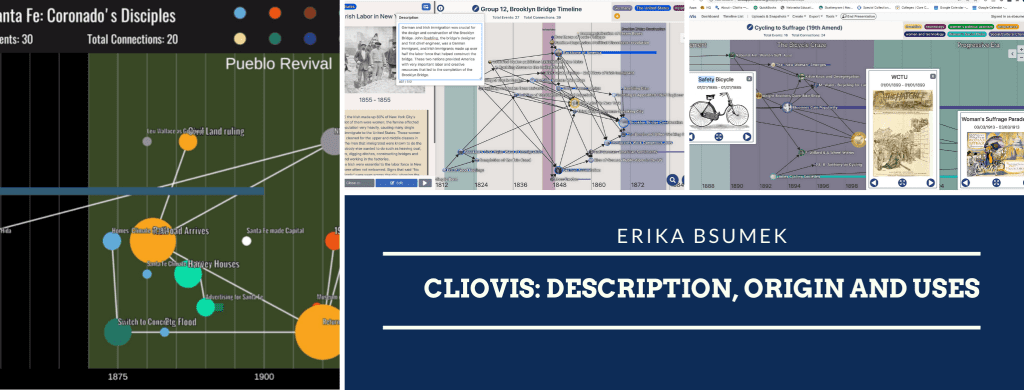
From the Editor: This article is part of a wider series that explores how teachers and students across the History department, the university and world more generally are responding in new ways to the unprecedented classroom environment we face in a time of global pandemic. The goal is to share innovative resources and ideas with a focus on digital tools, scholarship and archives. This article is one of a number exploring ClioVis, an innovative digital timeline tool developed by Dr Erika Bsumek. As we all struggle with online teaching and how to engage students in a virtual classroom, there is a need for reliable technology that allows students to collaborate effectively while interacting with historical sources. Here ClioVis is enormously helpful, providing students with new ways to organize complex information and to show historical inter-connections. This article is best read alongside A Year in Time: The Student Experience of ClioVis and an accompanying interview with Dr Bsumek.
ClioVis: Description, Origin and Uses
by Erika Bsumek
ClioVis software combines the best features of digital timeline and mind-mapping software for use by researchers, students, or instructors. The software allows users to chart events chronologically and map them conceptually, illustrating connections along the way through the use of visualization software. ClioVis helps users better understand the materials they are studying, provides an intuitive way for them to organize their research/course materials, and makes it easy for them to present their findings to external audiences. In addition, it also teaches students how to cite their sources and to begin to understand how to differentiate between causation and correlation.
Origins
ClioVis was born from a sense of frustration. After spending 18 years in the classroom, I realized that many students enrolled in lower-division history courses had difficulty understanding the complexities of history. This is borne out by a recent article in Perspectives which detailed the high failure rate in lower division American history courses. This is important not simply for a single course. Importantly, the study notes that U.S. history courses serve as an important indicator of a student’s potential success or failure at University regardless of their major.
Part of the problem is that history is messy! One thing students learn when studying history is that historical events do not unfold neatly. This can make the larger narrative difficult to follow. In addition, students can easily feel overwhelmed by the amount of information they encounter. All of this means that students often fail out of or underperform in lower division courses.
Aware of this problem, I sought to find a way to help students. The question I sought to answer is: how can we make the history classroom more interactive, collaborative, and evidence-based while also helping students organize and make sense of the information they find or are assigned? To do that, we have to get students to embrace complexity and move beyond chronology and simple memorization.
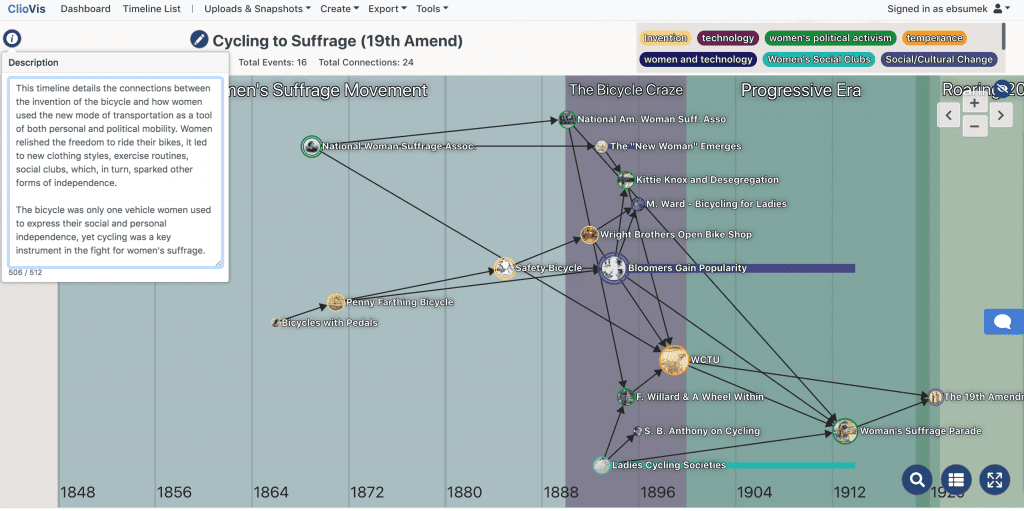
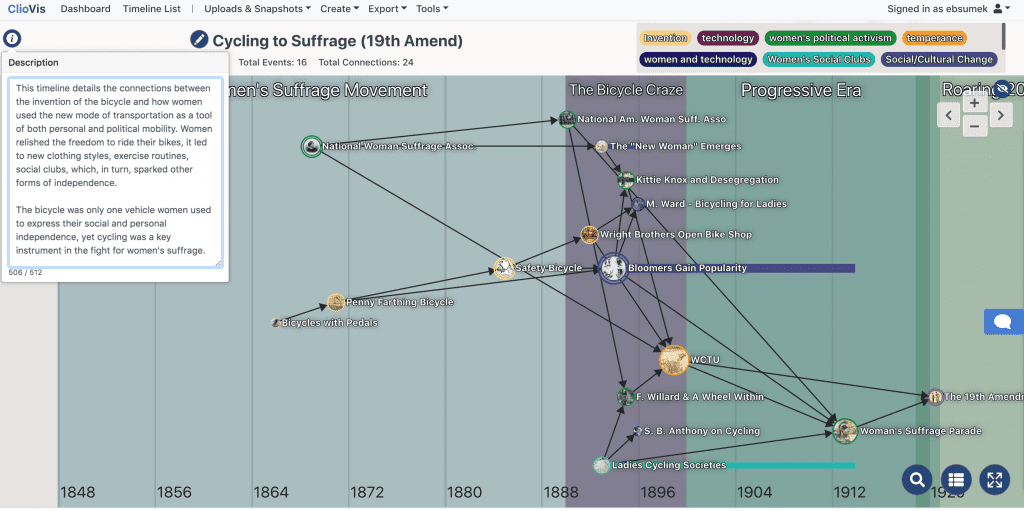
ClioVis timelines are very different than simple linear timelines where students just plot events in time, ClioVis timelines help learners plot connections across time! In other words, chronology is only the first part of gaining a fuller understanding of how and why certain events unfolded the way they did. While I developed ClioVis to use as a classroom aid, it can also be used to help students conduct research (see Haley Price’s article on Not Even Past)
ClioVis in action
Almost any period of history is not driven by a single event but by a confluence of events and forces. One thing I wanted to do in the classroom is to help students to visualize what they were studying while also helping them gain a deeper understanding of the historical connections at play in across different time periods or eras. By using ClioVis students actively make and explain those connections themselves. This means that students more deeply engage with course materials and learn to think analytically.
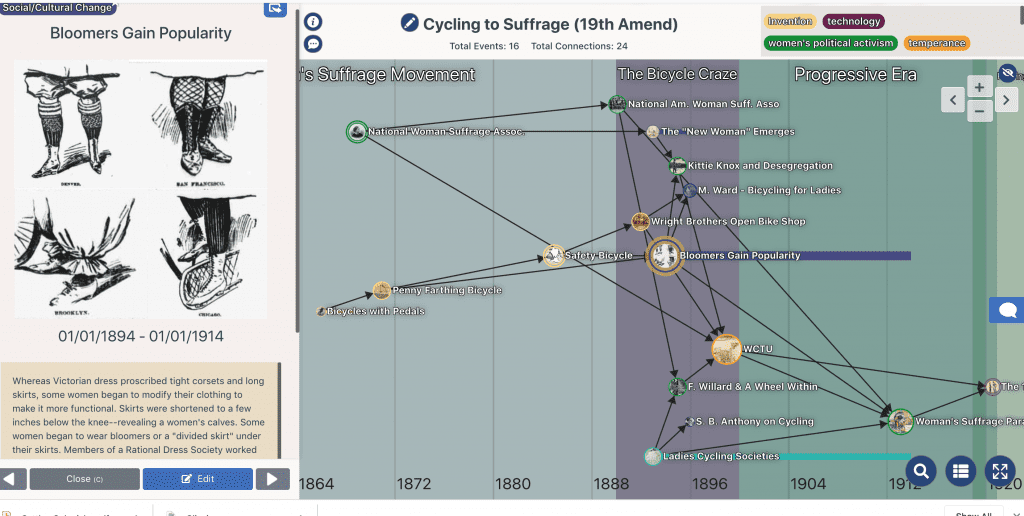
As students make historical connections in the timelines they create they also learn the craft of history and the gain a better understanding of how to differentiate between events that happened to occur at the same time and events that were actually related and/or connected in some way.
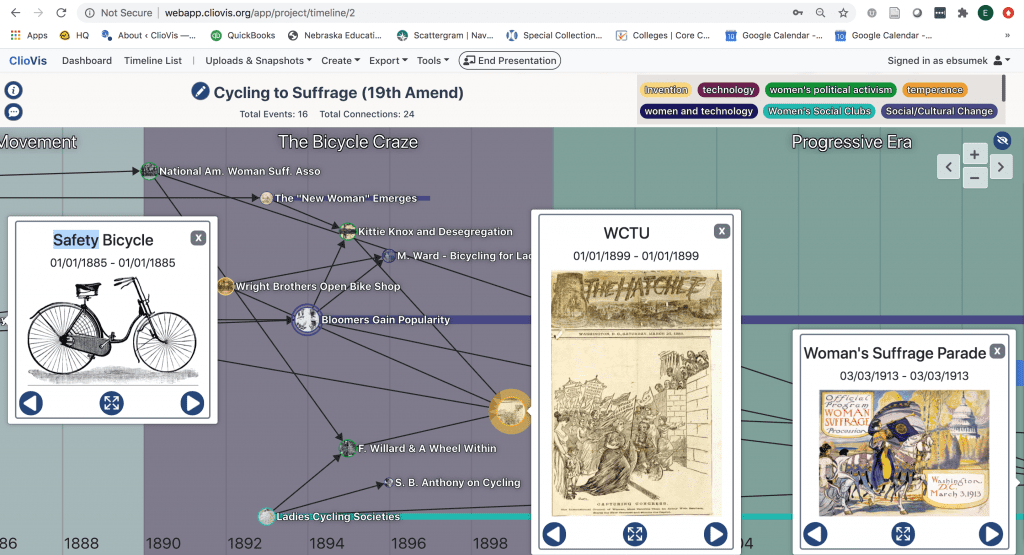
This helps them learn to the skills of critical thinking, evidence-based learning, and analysis and to learn to identify the difference between causal v. correlative historical factors. As students cite their sources and justify the connections they made, they develop higher level thinking skills.
Let’s say we wanted our students to understand more about the multiple historical forces that contributed to the 2020 Black Lives Matter protests? How far back would we want to go? In the timeline below, you see that we could take things back to the colonization of the United States and the introduction of slavery. Just looking at the timeline might even make you feel overwhelmed. But, the key is that students who researched this topic explored many different areas, plotted them, and then had to figured if or how they were connected. So, while the timeline looks “messy,” the work that went into it reflects a real investigation into the past.
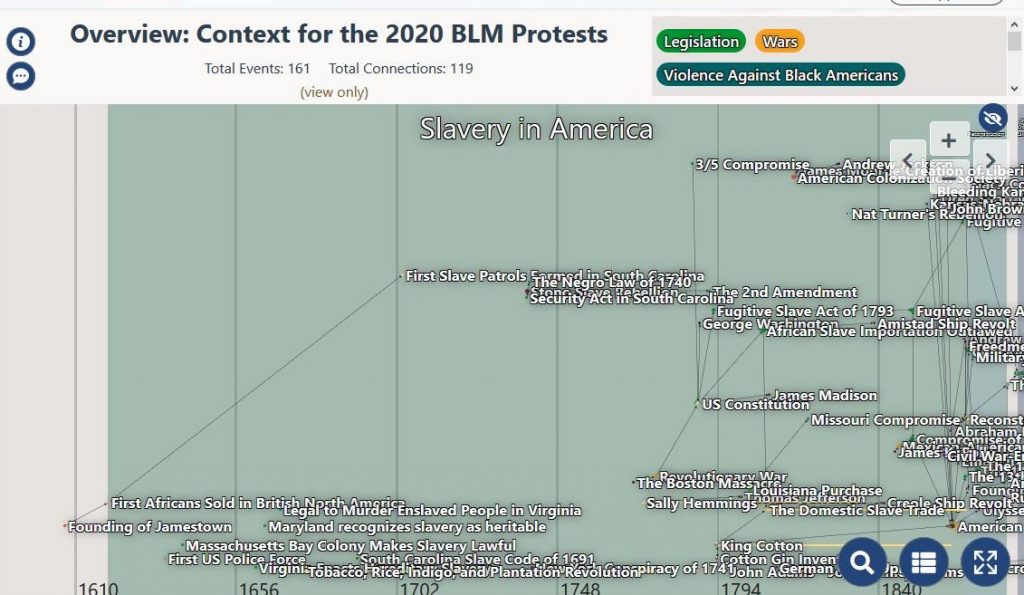
ClioVis starts with a simple idea: Just because history is messy doesn’t necessarily mean one cannot bring some order to the process of understanding it. To help with that, students can create categories that can be used to organize or “tag” specific events based on the ways that historical subfields function (i.e. economic history, political history, cultural history, etc.). When they do that, they learn that such categories are only one part of gaining a fuller understanding of an event by linking specific events to others with different categorical classifications.
Because ClioVis is a remote learning technology that facilitates collaboration, students can work together to discuss the best way to organize information, assess different historical interpretations, and determine which one(s) they think best fits what their findings.
When they are done, students can event present their findings directly from ClioVis because it has presentation tool and as well as an export feature. So, they can make narrated timelines that work like mini-documentaries or they can export or embed the timelines in websites or digital portfolios.
In the end, ClioVis may not help transform a D student into an A student, but using the technology can help them earn a better grade in a lower division history class, move them closer to graduation, and will teach them to think analytically in the process. It is my hope it will help them develop the skill set they will need to succeed in other courses and beyond. One final point, students who use ClioVis are doing more than learning history; they are also developing their digital skill set. If they wish, they can even share their ClioVis timelines to potential employers to show off the kinds of sophisticated analysis they can perform.
The views and opinions expressed in this article or video are those of the individual author(s) or presenter(s) and do not necessarily reflect the policy or views of the editors at Not Even Past, the UT Department of History, the University of Texas at Austin, or the UT System Board of Regents. Not Even Past is an online public history magazine rather than a peer-reviewed academic journal. While we make efforts to ensure that factual information in articles was obtained from reliable sources, Not Even Past is not responsible for any errors or omissions.


