By Haley Price
Haley Price is a senior majoring in history and honors humanities. Her research interests include the nexus between games and history education as well as the Italian Renaissance. She hopes to combine these interests in her senior thesis, then go on to pursue further study with a focus on digital history. This article is part of a wider series that explores how teachers and students across the department, the university and world more generally are responding in new ways to the unprecedented classroom environment we face in a time of global pandemic. The goal is to share innovative resources and ideas with a focus on digital tools, scholarship and archives. This article is one of a number exploring ClioVis, a innovative digital timeline tool developed by Dr Erika Bsumek. This interview can best be read alongside ClioVis: Description, Origin and Uses. A conversation with Dr Bsumek about ClioVis can be seen here.
With classrooms and libraries closed this year, life as a history student is a unique challenge. I’m heading into my senior year as a history major, and I think I can be honest that, no matter how excited I am for my class schedule, I’m not looking forward to doing it online. Even though this isn’t the senior year I had hoped for, I think there are still opportunities to do great undergraduate research, even while staying at home.
I’ve always had an interest in digital history and I’ve been working with online tools for a long time now, so I know there are ways to make online learning more effective. I’m especially grateful that there are so many digital tools to help students engage with the past. ClioVis is one of the best of them. Though it is no replacement for the community we find in the classroom, ClioVis has become a hugely valuable tool for me when it comes to research. I find it also brings some excitement back into doing historical work remotely.
I have been working with ClioVis for about two years now. A digital timeline tool, ClioVis was developed by Dr. Erika Bsumek to help students visualize historical connections.
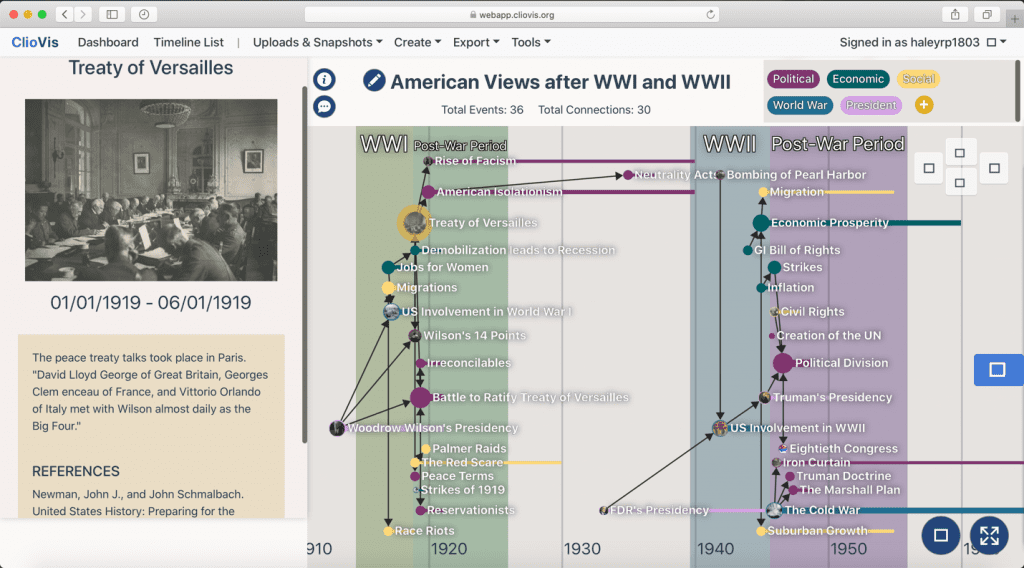
I’ve found it equally useful as a research aid. I’ve made about a dozen timelines using the software. As the ClioVis undergraduate intern, I’ve made timelines on the American Revolution, America in the World Wars, Shakespeare’s Plays, the Italian Renaissance, Angkor Wat, the Black Lives Matter movement , and many more.
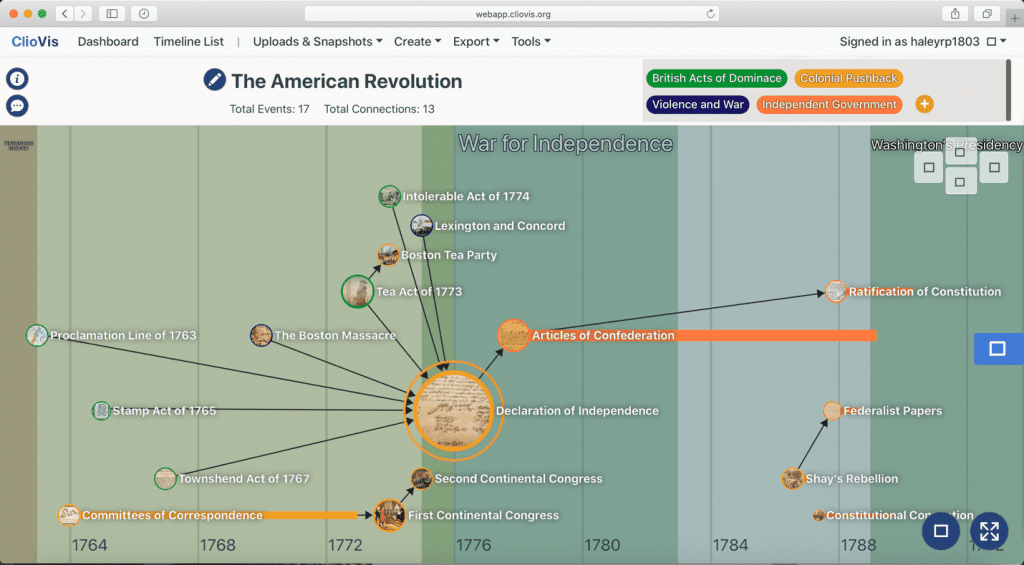
For most of these timelines, I was working with a set of dates and facts that I had to translate into a visual format. The goal was to visualize the order of events and how they related to, or impacted, one another. Often, I was looking across a very long span of time, sometimes several hundred years.
In this article, I want to introduce how I used ClioVis to dig deep into a single year. One of my best and most rewarding ClioVis experiences was for a classroom game focused exclusively around just one year in Russian history: 1877. As part of the “Reacting to the Past” series, my professor, Dr. Linda Mayhew, developed a classroom game to teach students about Russian culture and literature on the eve of revolution. Students roleplay as historical figures such as Tolstoy and Dostoevsky while publishing political commentary and literature in highly competitive journals. They compete with classmates to win victory objectives relating to Russian history. Students are broken up into political factions for the duration of the game. In this game, the groups are the Westernizers, the Populists, and the Slavophiles, each with different priorities and victory conditions.
I took Dr. Mayhew’s class in the spring of 2020 and worked as a research assistant on the game’s development over the summer. To better ground students in their historical context, I worked with Dr. Mayhew to develop a series of newspaper bulletins to accompany the game. My role was to write short articles about current events in Russia, Western Europe, and the United States that took place in the year 1877.
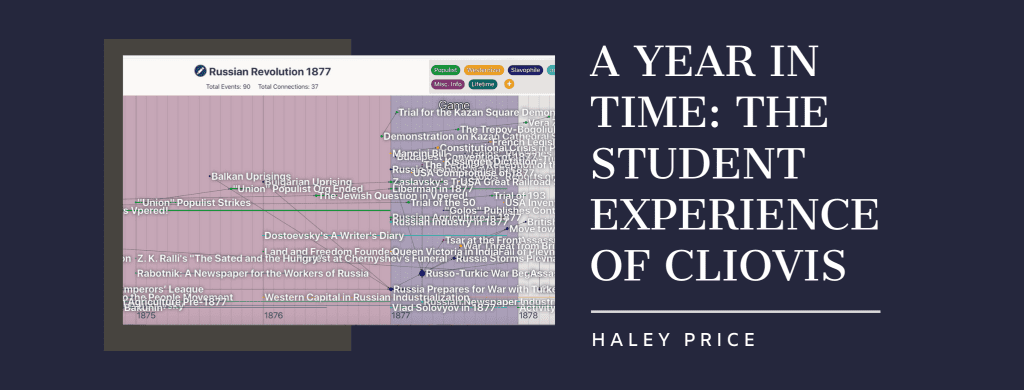
A lot happened in 1877. Domestic and international events combined to drive a sense of crisis. You can see that complexity immediately here, and how ClioVis enables you to link these events together.
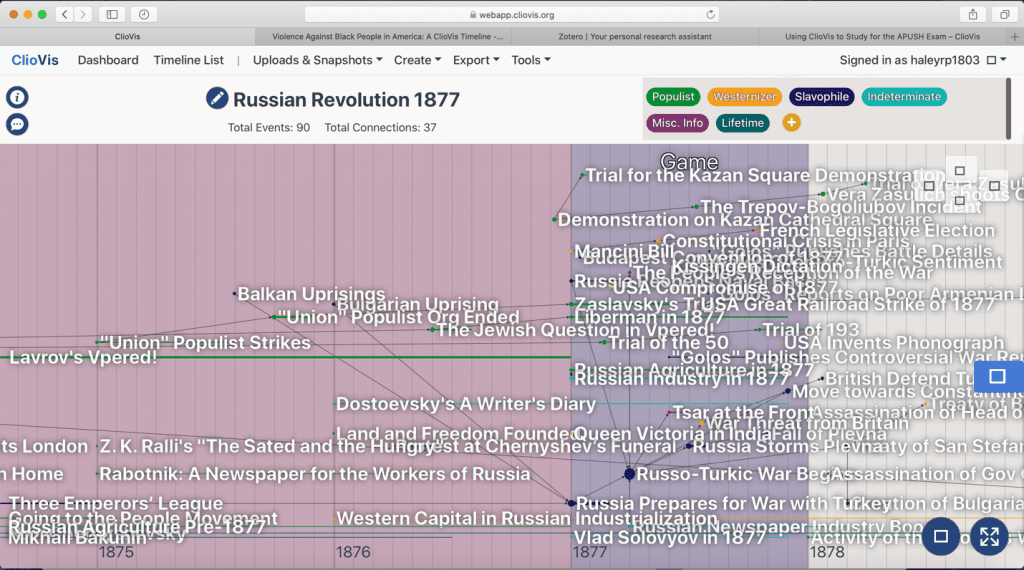
Using this as a basis, I built newspaper bulletins such as the one below
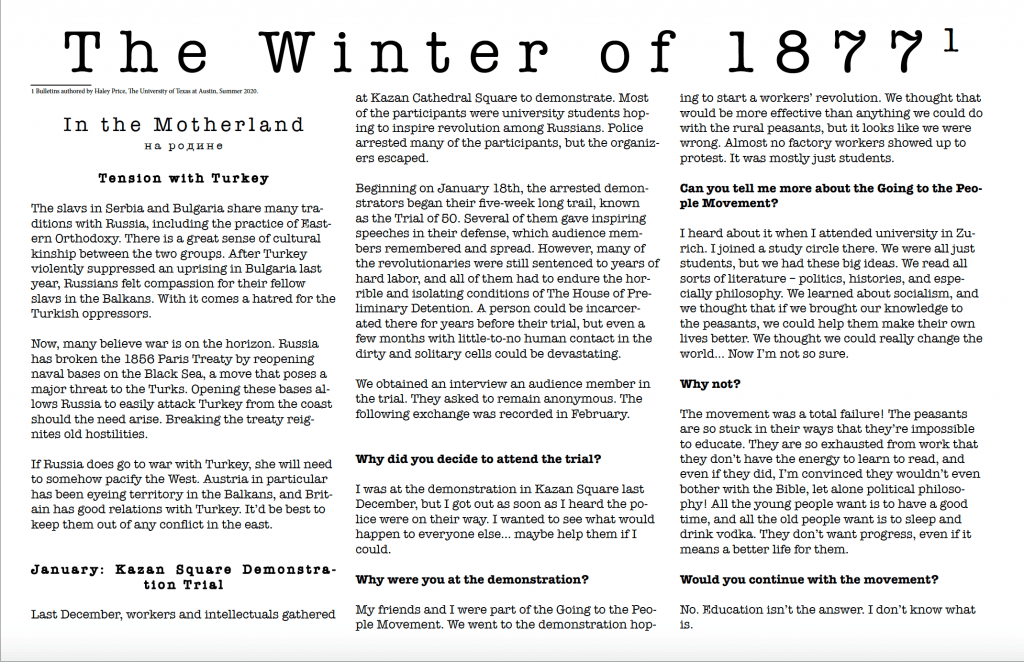
The bulletins were intended to specifically focus on current events in 1877. This meant I needed to understand exactly what was happening domestically in Russia at the time, as well as a number of major international events. Everything from the living conditions of Russian serfs to the use of coking in British steel production was useful to me, so long as it deepened my knowledge of life in 1877.
The timeline is messy because I added a new event node each time I found information relevant to my bulletins. I started by reading about the Russo-Turkish War (which is a major event in the classroom game), and I took notes using the timeline while I read. I found articles on the major events of the war itself, so I made event nodes for the build-up to the war, key battles, and its treaty resolution. I also came across names, dates, and events that weren’t about the war at all. I made event nodes for this information, too, hoping it would lead my research in new directions.
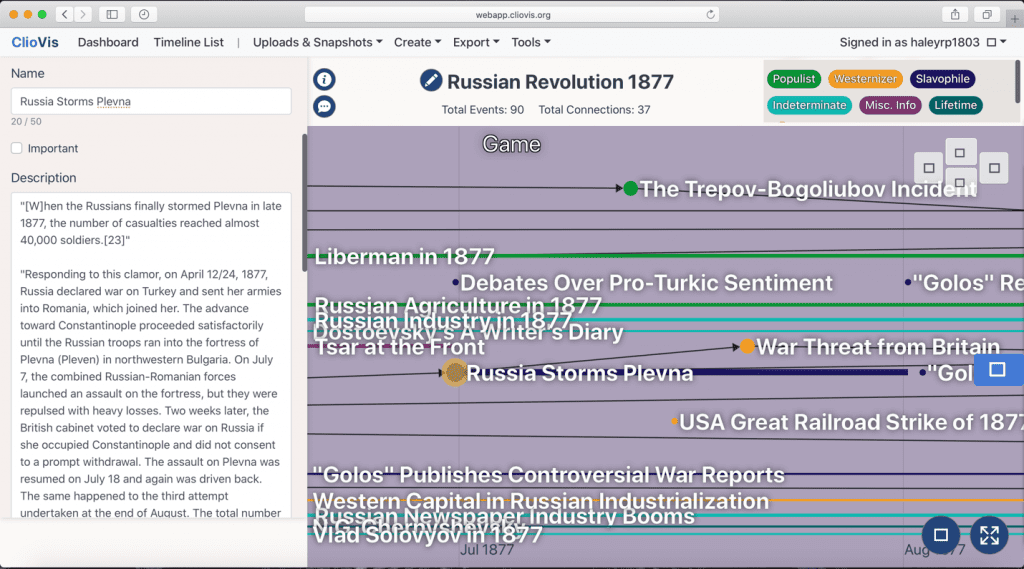
The more I allowed the research to flow naturally, the bigger my timeline got and the richer my knowledge became. In that way, the visualization project mirrored the year itself. It grew ever more complex, and the events revealed themselves to be increasingly interconnected.
As exciting as this kind of research is, following up on every interesting lead creates an overwhelming number of articles to work through. When I do that much reading, I struggle to take the right notes and keep track of my sources. ClioVis was a huge help in that regard. Every ClioVis timeline is made up of event nodes. One can edit these in a number of ways. I used the event descriptions to pull useful quotes from articles as I read them. That way I could spend less time rereading my sources when I wrote my final articles. I would copy a paragraph or two from the article and paste it into an event’s description box in ClioVis. I would often pull multiple passages that highlighted information I knew I wanted to write about.
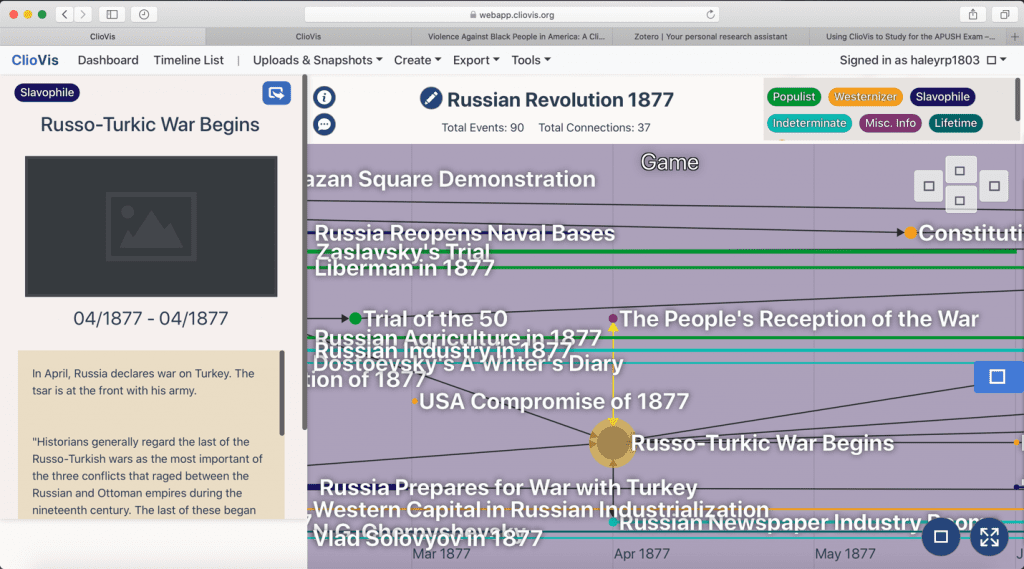
I drew connections when I wanted to remember how certain events were related. This creates a visual through line that tends to mirror the kind I might use in writing. I usually ended up grouping the visually connected events in a shared paragraph or article.
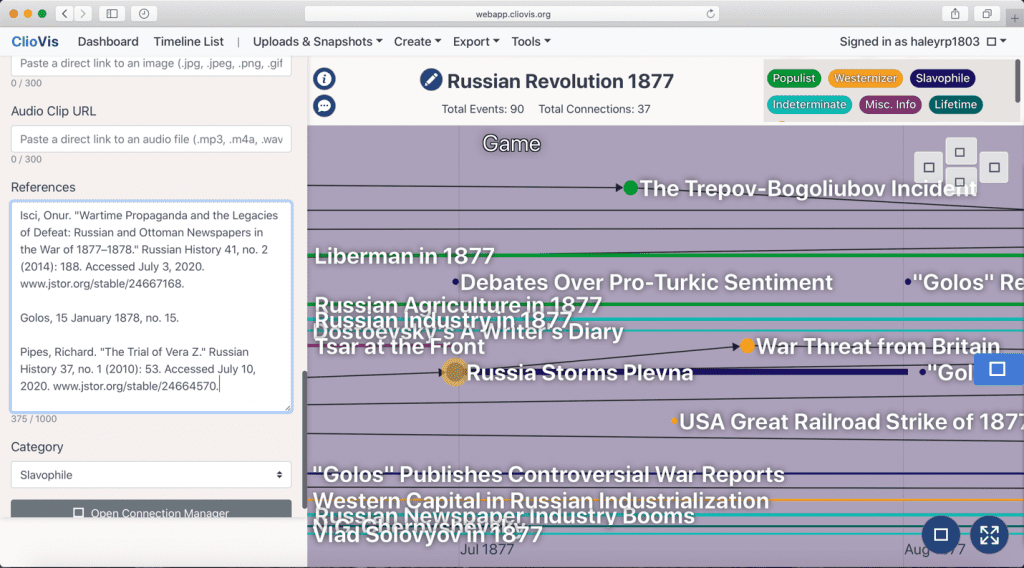
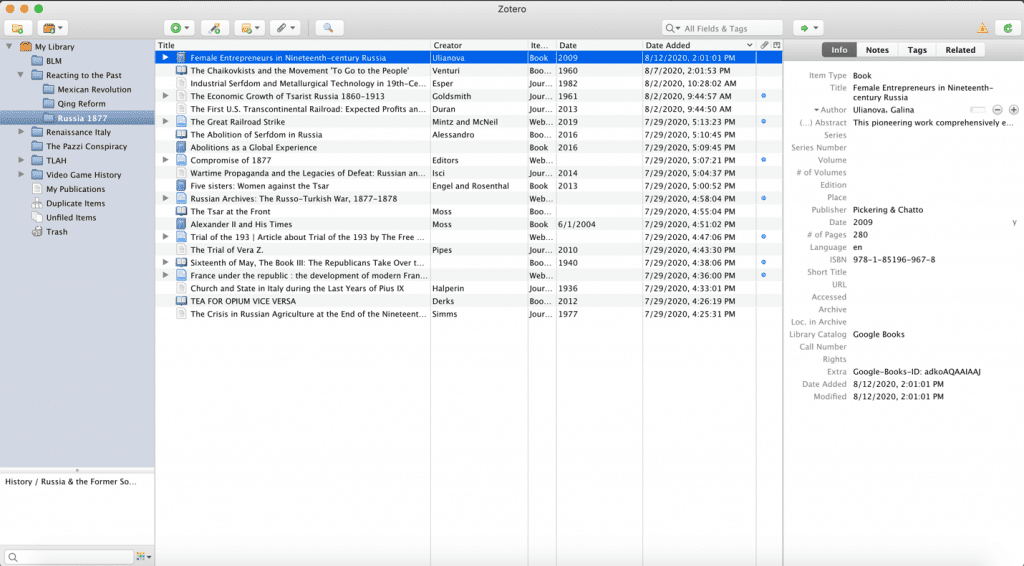
The last step in my research was to cite my sources. Even though I find it tedious at times, I always cite as I go. Pairing ClioVis with an auto-cite program makes the process so much easier for me. Something like EasyBib would work fine, but I switched to the browser plug-in Zotero recently. Zotero is useful because it automatically saves all of the citation information to an entry in my virtual library. That way I can come back to a text later and cite it in a different style without having to find the original source again. I copy and paste my citations from Zotero into the relevant ClioVis event so that I always know where my notes came from. This takes almost all of the effort out of citing when I’m writing later because everything is already organized.
Across my experience with this class, I found that ClioVis was a remarkably useful tool that enabled me to deal with and visualize historical complexity. In this project, it not only allowed me to compile my research in a way that was both flexible and adapted for my project’s specific needs, but it also showcased the complexity of a single year. The sheer number of events appears overwhelming at first – how could so much have happened in such a short time frame? When one looks more carefully at the timeline, it becomes clear that many of the events are part of larger processes that were ongoing before 1877 and would continue afterwards. I’ve noticed historians often focus on these larger processes and lose some of the specificity along the way. Focusing on just one year makes the timeline detailed and personal. For me at least, it helps me remember that history is a collection of real events that shaped, and were shaped by, real people.
2020-21 will be a year marked by online learning. As a student, I can say that it’s not the same as in person classes, but thanks to innovators like Dr Bsumek, we also have the tools to do historical research in new ways. For a student like me, that’s exciting because it opens up new ways to view and interact with the past.
The views and opinions expressed in this article or video are those of the individual author(s) or presenter(s) and do not necessarily reflect the policy or views of the editors at Not Even Past, the UT Department of History, the University of Texas at Austin, or the UT System Board of Regents. Not Even Past is an online public history magazine rather than a peer-reviewed academic journal. While we make efforts to ensure that factual information in articles was obtained from reliable sources, Not Even Past is not responsible for any errors or omissions.
