In New York City, buildings are like wallpaper. If you peeled back the facades and peeked into their histories, you’d find something different, something out of style. The buildings’ old identities wouldn’t match the modern character of the neighborhood. On the Lower East Side, if you peel back the layers of luxury apartments, churches, and fusion restaurants, you’d notice a trend. Many buildings that now house fashionable venues used to be synagogues.

The first synagogue established in Manhattan dates back to 1654. Congregation Shearith Israel (also called the Spanish and Portuguese Synagogue) is the first in a long line of immigrant synagogues that continue to identify with their countries and towns of origin. I became interested in old synagogues like this one because of two courses I took as a history major at UT Austin.
I took Yiddish (YID 604 and 612) with Dr. Itzik Gottesman. There, I learned about the Jewish immigrant culture of New York. I applied this newfound information to a project in HIS 366N (History and Data Tools) with Professor Andrew Akhlaghi. In this class, we used Python to look at historical datasets and reveal change over time. Many of the graphics in this article come from my final project for that course.
The historical data I looked at was originally collected by the Center for Jewish History (CJH). The CJH looked over documents like the New York Jewish Year Books and government reports on Jewish organizations. The data reveals that, between 1850 and 1930, nearly 1,000 synagogues were established in Manhattan alone.
How did so many synagogues fit in such a small area?
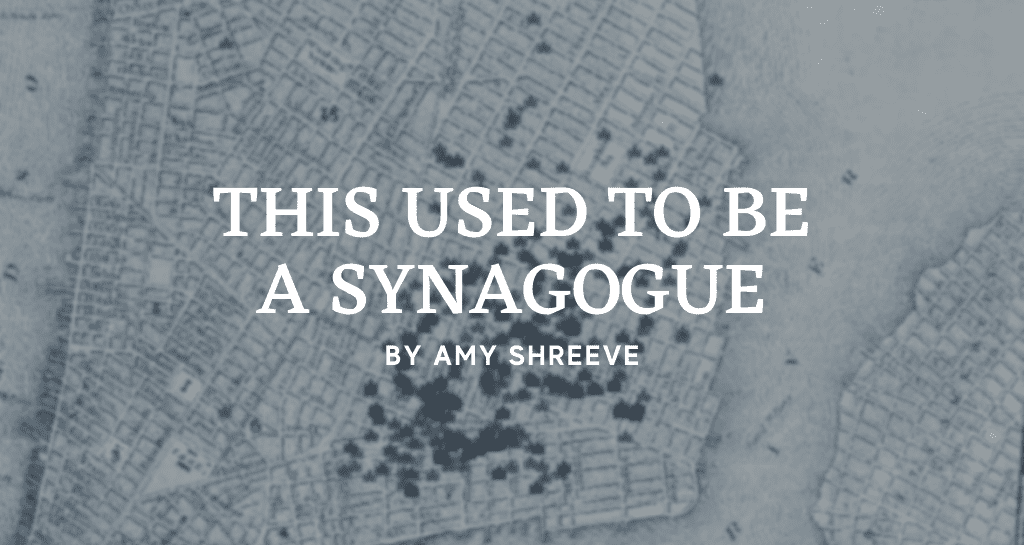
The answer is that they didn’t, really. Most of these so-called synagogues were small congregational immigrant groups, commonly referred to as landsmanshaftn. These are organizations of neighbors from one country living in another. Some congregations built structures that can be immediately recognized as synagogues through their iconography and architecture. However, other, poorer groups had to make do. A landsmanshaft might squeeze into a one-room apartment for morning minyan. It might rent a dance hall for High Holy Day services. These spaces could become an organization’s address.
This is why synagogues appear to be stacked atop synagogues on the map. Over 900 of the 1,016 entries on the map are squeezed into one square mile.

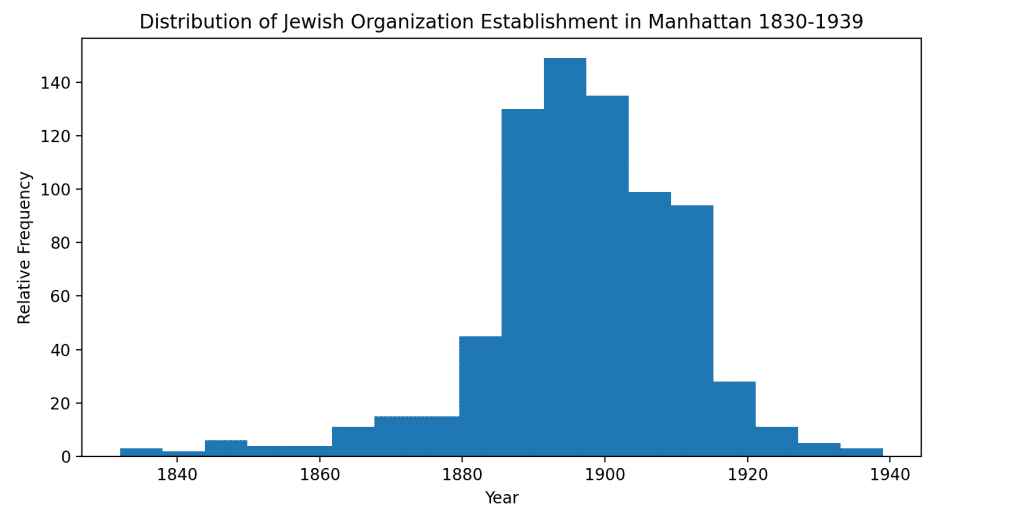
The Center for Jewish History data also yields other interesting conclusions and applications. We can use the dates of establishment to visualize when immigrant synagogues were founded in New York. The dates of new synagogue formation seem to peak in the late twentieth century. This data corroborates previous literature about the volume of immigrants arriving in New York each year.
One unique feature of landsmanshaftn are their names. Because groups came from particular locations, they tended to reference those places in their names. By reading the names, we can get an idea of immigrants’ place of origin.
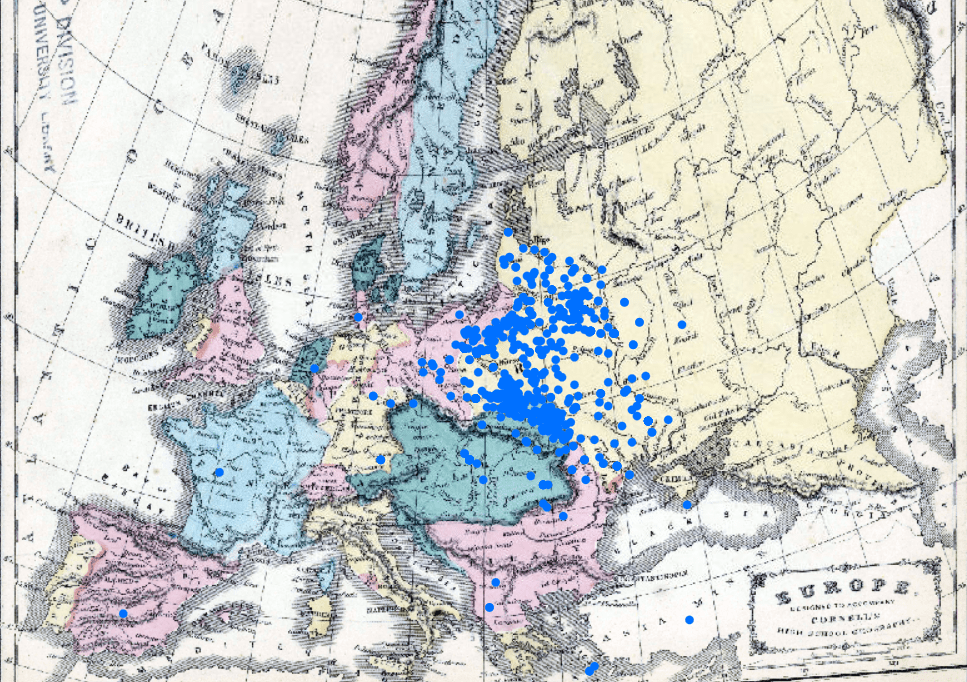
The locations can also be represented in this pie chart:

I created an interactive display with this data by making it into a Twitter Bot (@OldShulSpots). Several times a day, the bot peels back a layer of New York by posting a picture of New York now captioned with the name of the synagogue that used to be situated at the location.
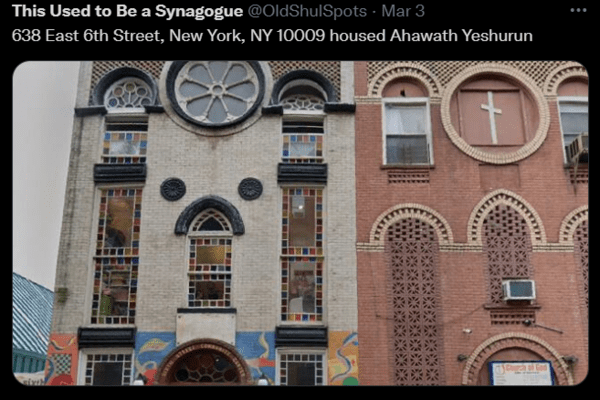
This allows people to interact with the city even if they aren’t actually in it. It encourages reflection about sites that were once located in one’s own city. For many people, this commemorative profile provokes nostalgia and remembrance. It currently has over 1000 followers.
A few of these people have reached out to me because they have researched old synagogues in a different way. I am applying for research funding to visit two individuals who have been photographing or collecting images of old synagogues throughout the Northeastern United States for the past fifty years. I plan on digitizing their photo collections so that other people can see and study old synagogues in their former glory.
The Jewish immigrant history of New York is hidden just below the surface. We can dig into it by reimagining the geographies of the time and interacting with new locations while remembering the old. I hope as well that this project yields inspiration for students majoring in history. Computing and coding are very useful and accessible tools in the humanities. By harnessing them, you may be able to dig deeper into a topic that you’re passionate about.
Amy Shreeve is a junior at the University of Texas at Austin studying Rhetoric & Writing and History. Additionally, she is receiving certificates in Computer Science and Digital Humanities. Amy’s interests center around Yiddishkeit in America, technical writing, and commemorative geography. She currently works with Dr. Edmund Gordon on the Campus Contextualization and Commemoration project. In this project, she is mapping old census records onto historic Austin in order to see demographic trends in the city. Amy owns every National Geographic published between 2000-2013 and many non-consecutive issues since.
Citations
Baron, Salo Wittmayer, The Jewish Community, Its History and Structure to the American Revolution. 3 vols. Philadelphia: The Jewish Publication Society of America, 1942. 374, 366, 572.
Brown Harris Stevens, 317 E 8th Street Photo 0, electronic, Brown Harris Stevens realty, https://www.bhsusa.com/manhattan/downtown/317-east-8th-street-th/rental/19557368.
Cornell, S. S. Europe: designed to accompany Cornell’s High school geography – TexasGeoDataPortal, 1850. https://geodata.lib.utexas.edu/catalog/princeton-wm117r45c
Lionel Pincus and Princess Firyal Map Division, The New York Public Library. Map of the city of New York. The New York Public Library Digital Collections, 1850. https://digitalcollections.nypl.org/items/d2a04eb0-f3a1-0130-32d3-58d385a7b928. Data displayed on the map sourced from the Center for Jewish History.
Soyer, Daniel. Jewish Immigrant Associations and American Identity in New York, 1880-1939: Jewish Landsmanshaftn in American Culture. Wayne State University Press, 2018. Project MUSE, doi:10.1353/book.61466.
All Streetview photos are from Google Streetview and used with permission granted by my Google Dev account.
Maps generated with ArcGis Pro. Graphs generated with the Python package matplotlib. Data from the Center for Jewish History’s synagogue map.
Code for Twitter bot adapted from Neil Freeman’s “everylotbot.” Developed using Google and Twitter APIs.
The views and opinions expressed in this article or video are those of the individual author(s) or presenter(s) and do not necessarily reflect the policy or views of the editors at Not Even Past, the UT Department of History, the University of Texas at Austin, or the UT System Board of Regents. Not Even Past is an online public history magazine rather than a peer-reviewed academic journal. While we make efforts to ensure that factual information in articles was obtained from reliable sources, Not Even Past is not responsible for any errors or omissions.

