This article coincides with an upcoming public talk at UT on Pauliceia 2.0, January 28 at 4:00 p.m. For more details, please visit the event page.
While passing through Austin on vacation in 2015, Brazilian historian Luis Ferla went for a walk across the UT campus. He was mulling over new projects for the research lab he coordinates, “History, Maps, and Computers” (Hímaco), at the Federal University of São Paulo.
As he crossed the Forty Acres, inspiration struck: what if, he thought, we developed a digital mapping platform where a variety of people–researchers, teachers, students, even neighborhood residents–could create, explore, and share information about a city’s past? What if, he wondered, we made the underlying technical architecture of that platform openly and freely available for use in other urban contexts, in Brazil and beyond? Ferla’s vision–what Hímaco students would come to call a “Google Maps for the past”–was set.
In the ten years since that reflective walk, the initial idea has become a beta-stage reality: the collaborative, open-source historical mapping platform Pauliceia 2.0.
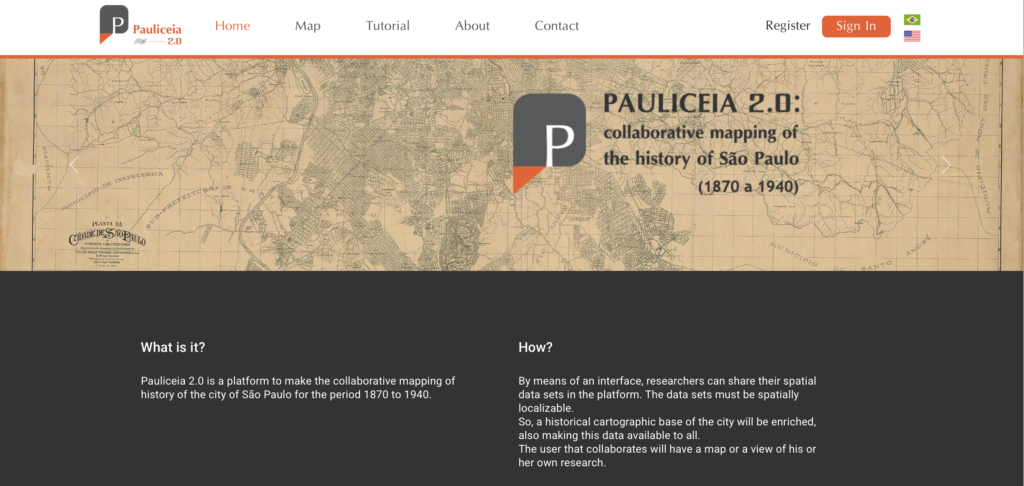
A screenshot of the Pauliceia 2.0 homepage.
Produced by historians, computer scientists, and software developers in Brazil and the United States, the platform focuses on the city of São Paulo between 1870 and 1940. Today, São Paulo’s nearly 20 million residents make it the most populous city in the Western Hemisphere. The city’s growth, however, only began in earnest in the late nineteenth century: from 30,000 residents in 1870, the city grew to over 1.3 million by 1940. In this seminal period, the city also gained the affectionate, poetic nickname (Pauliceia) that would inspire the name of the platform.
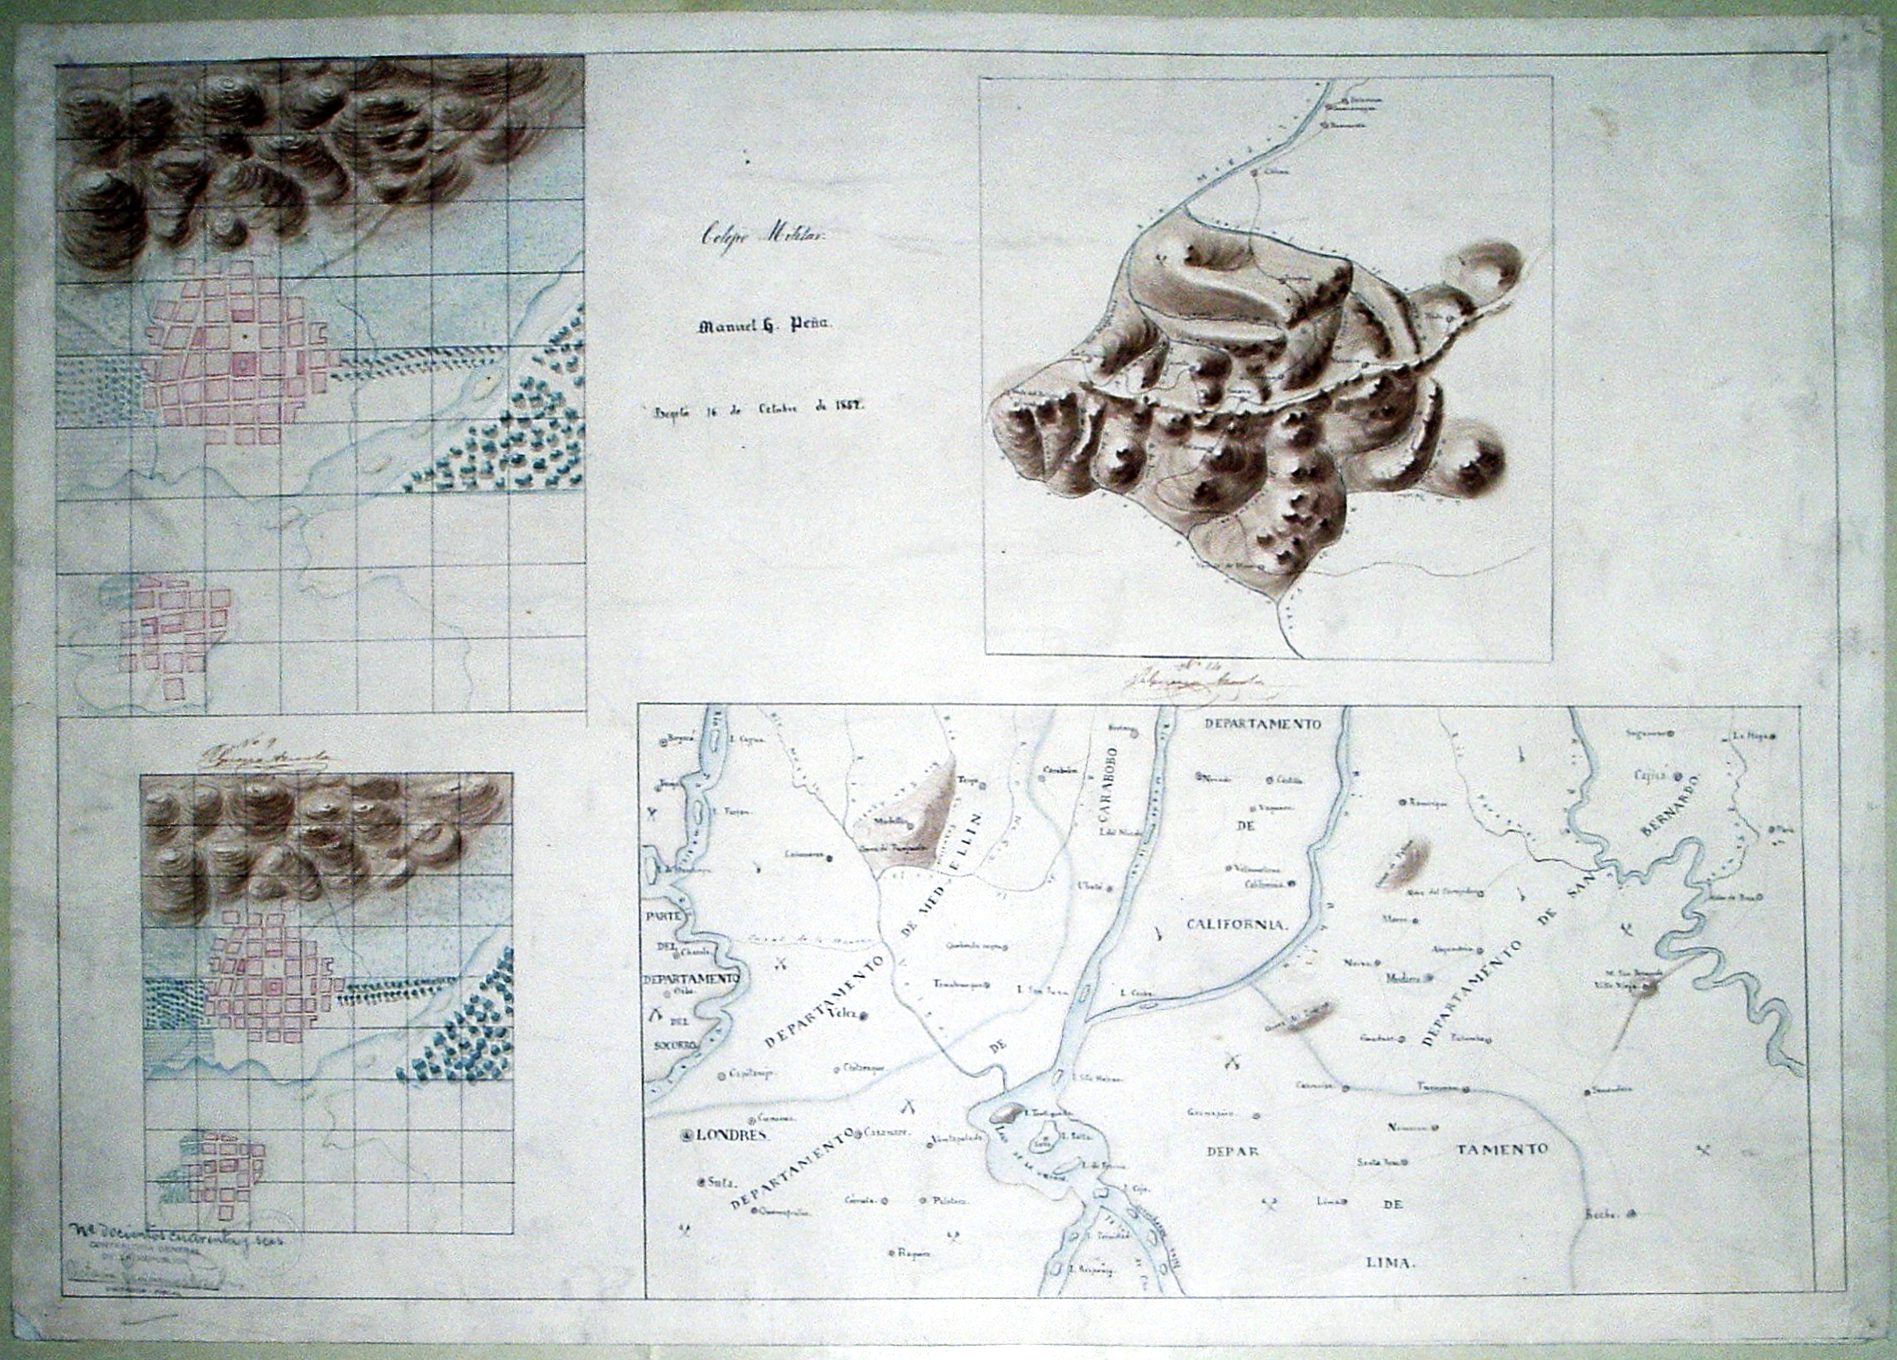
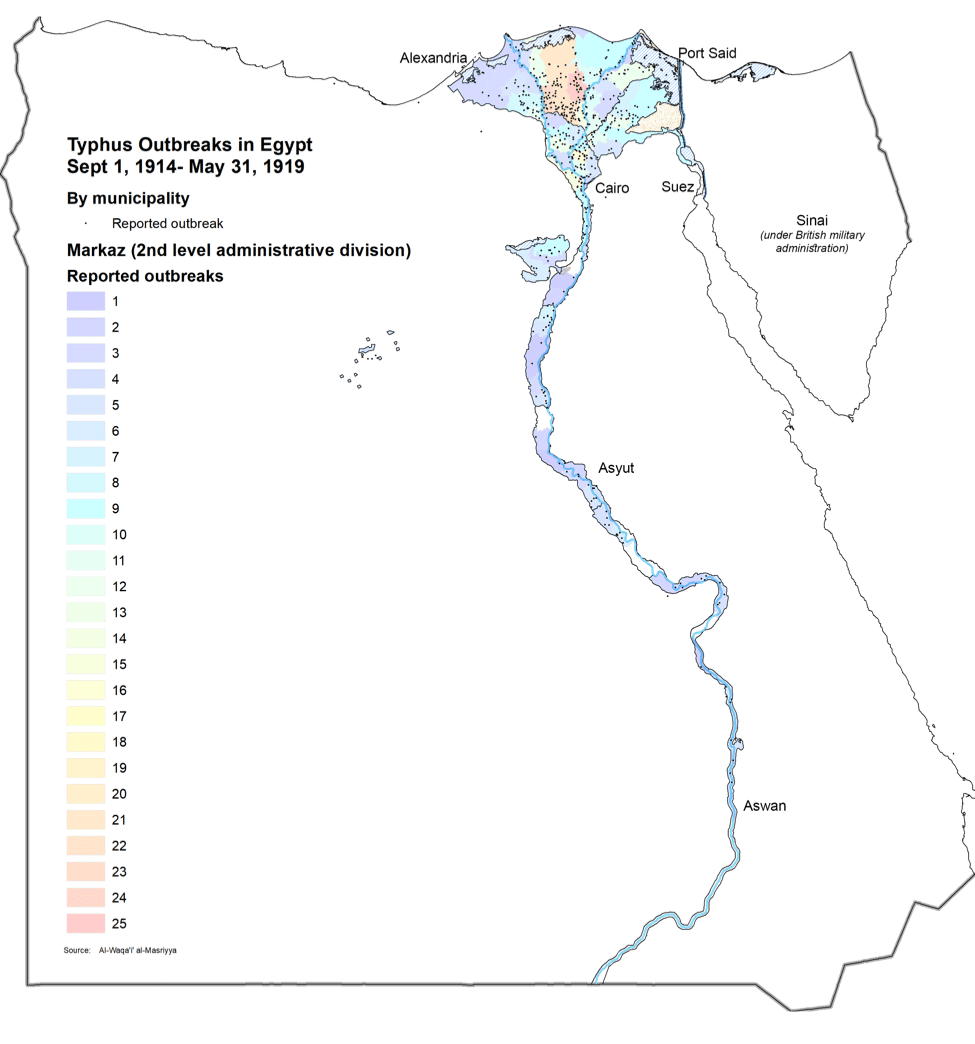
If Pauliceia 1.0 was the real, material city of 1870-1940, Pauliceia 2.0 is a digital reconstruction containing a selective, yet richly varied, collection of information about the city. The beta platform contains seven layers of georeferenced historical maps of São Paulo, stretching from 1868 to 1930, that provide cartographic context and allow users to trace the city’s development over time. This early release also contains many thematically-focused layers, most created and submitted by contemporary researchers, that display geographic information about a range of topics: from significant Catholic churches and the former streetcar network to the sites of visiting circuses and disease outbreaks. The result of this process–a collaborative reconstruction of São Paulo’s past–will, we expect, advance the central promise of historical mapping: to illuminate relationships in space and over time, including those that might not be visible otherwise.
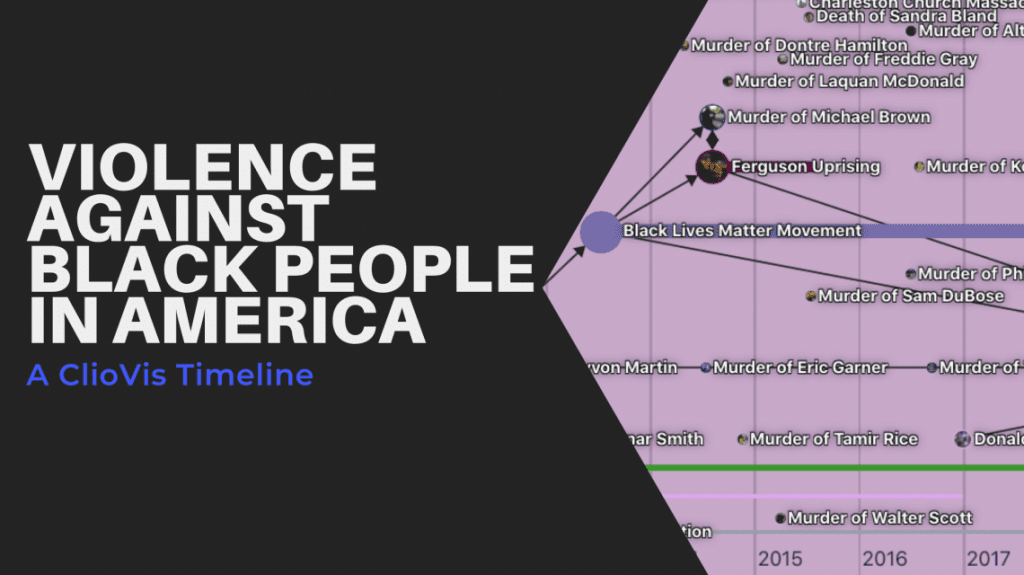
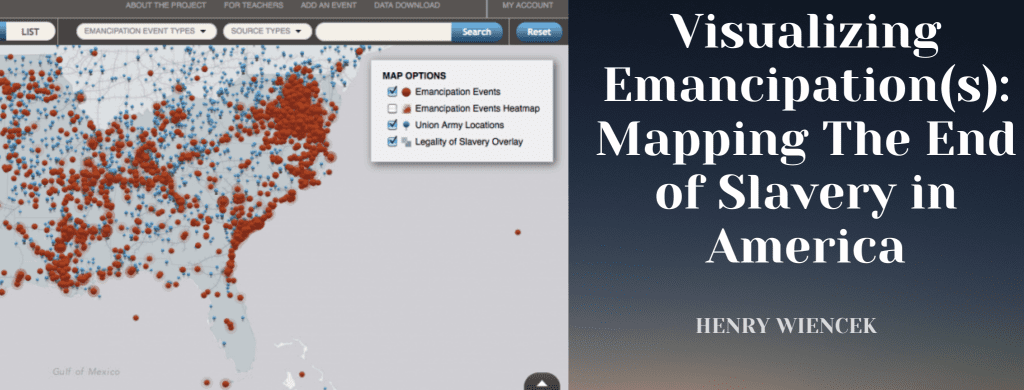
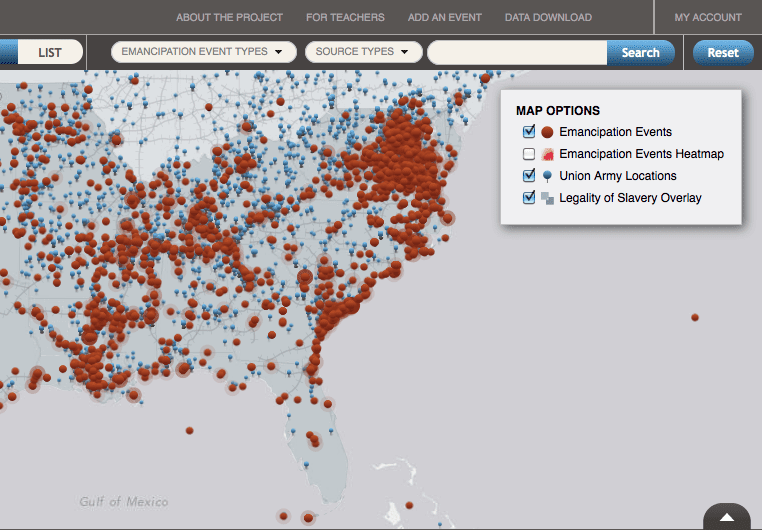
Use cases for the project also reach beyond the academy. In the wake of disastrous floods in São Paulo in 2020, journalists at Brazil’s largest newspaper, Folha de S. Paulo, used a layer that Hímaco created about a massive 1929 flood to show how, despite advances in urban infrastructure over 91 years, flood-threatened areas in the city remained largely the same. Though created before the beta release of Pauliceia 2.0, these flood layers are now on the platform, available for investigation and downloading. Separately, a group called Cartografia Negra (Black Cartography) has used the platform to remap places that held special significance for African descendants in the city, which in the nineteenth century was the provincial capital of one of the final frontiers of slavery in the Americas.
The Pauliceia 2.0 team has begun to further expand its public-facing mapping activities and partnerships. The team is, for example, collaborating with São Paulo’s municipal archive and residents in two of the city’s most historic neighborhoods to facilitate a series of community mapping initiatives. In the summer of 2025, representatives from Pauliceia 2.0 participated in the NEH-funded Community Deep Mapping Institute (one of only two accepted teams from outside the U.S.) to strengthen their knowledge of best practices with participatory mapping.
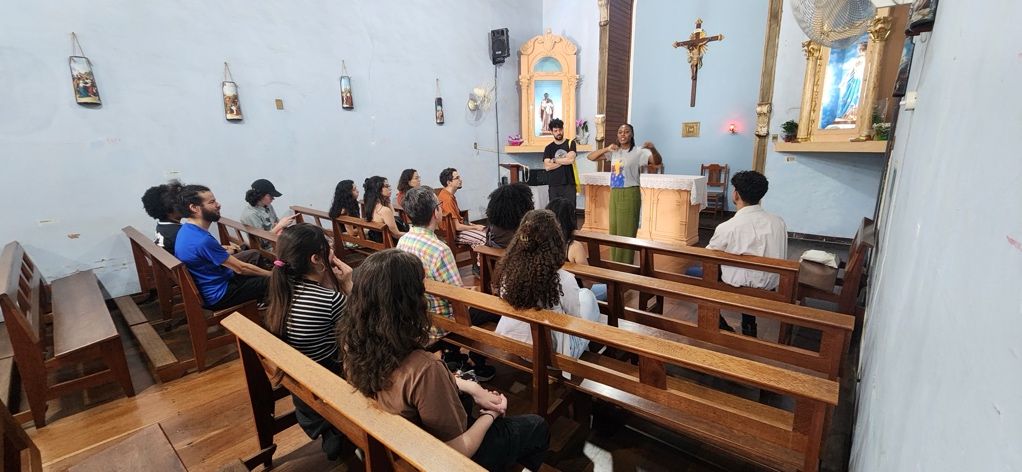
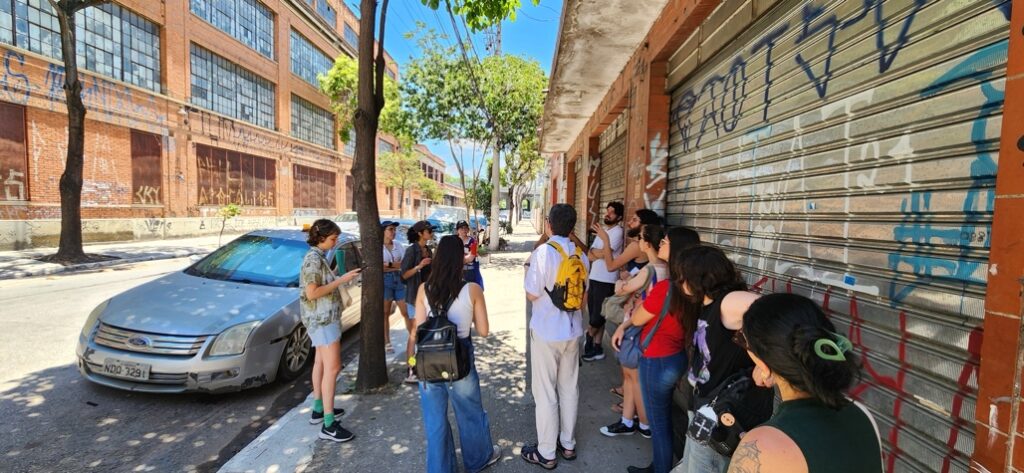
Photos of recent participatory mapping activities coordinated by the Pauliceia 2.0 team in the São Paulo neighborhoods of Penha and Bom Retiro.
In addition to its historiographical contributions, the Pauliceia 2.0 team has also produced technical innovations. Most recently, the team developed an algorithm that facilitates the location of historic street addresses. This tool is essential for historical research about cities like São Paulo, where street numbering has changed over time, and primary sources about spatial change are severely limited. The source code for the geolocation tool, along with the code for the project as a whole, is freely and openly available, a reflection of Pauliceia 2.0’s commitment to the principles of Open Science.
Luis Ferla will return to UT in the coming weeks, where he and UNIFESP graduate student Luanna Mendes will give a public presentation about how Pauliceia 2.0 is helping to expand our understanding of the ways urban history can be produced and shared. The presentation brings together an array of constituencies across UT, including the co-sponsoring units: the Department of African and African Diaspora Studies, LLILAS Brazil Center, UT Open Source Program Office, and School of Architecture Community and Regional Planning program.
While in Austin, Ferla and Mendes will also host a workshop in the interdisciplinary course “Bulldozed: Urban Destruction.” Cross-listed in African and African Diaspora Studies, the School of Architecture, and the School of Information, the spring 2026 version of the course will focus on São Paulo and Austin. Though they have many differences, of course, the cities also bear compelling similarities, especially a breakneck pace of urban transformation that involved widespread and much-debated demolitions. In addition to studying these cities’ histories, Bulldozed students will learn foundational skills of historical mapping and construct a layer to contribute to the Pauliceia 2.0 platform.
Andrew G. Britt is an Assistant Professor in the Department of African and African Diaspora Studies at the University of Texas at Austin. A historian of the Black diaspora with a focus on Latin America, his research centers on contemporary Brazil, digital humanities and emerging technologies, and spatial history.
The views and opinions expressed in this article or video are those of the individual author(s) or presenter(s) and do not necessarily reflect the policy or views of the editors at Not Even Past, the UT Department of History, the University of Texas at Austin, or the UT System Board of Regents. Not Even Past is an online public history magazine rather than a peer-reviewed academic journal. While we make efforts to ensure that factual information in articles was obtained from reliable sources, Not Even Past is not responsible for any errors or omissions.


